Tuesday, September 30, 2014

Hedge Funds Surpass 2007 Leverage; New Era of 'Permanent Investigations' Confirms Imminent Reversal


By Elliott Wave International

Editor's note: The following article was republished here with permission from the co-editors of the September issue of The Elliott Wave Financial Forecast, a publication of Robert Prechter's Elliott Wave International, the world's largest financial forecasting firm. From Sept. 25 to Oct. 1, EWI is throwing open the doors to all of its investor services 100% free. Click here to join EWI's free Investor Open House now.

Hedge funds are further out on the same limb they occupied in 2007, right before the collapse shown on this chart of the HFRX Global Hedge Fund Index.

According to Eurekahedge, a global hedge fund monitoring service, hedge funds' gross assets hit 170% of capital in January, which surpasses the previous peak of 168% in 2007.

Leverage at many of the largest hedge funds is far higher.

For instance, in April, the New York Post noted that Citadel Investment Group, one of the 25 biggest US hedge funds, had implied leverage of about 8.8 times its total investment capital. The Post also noted that Citadel's "leverage last came under scrutiny in 2008, when it had to unwind a leverage of 8.2 times as the financial crisis unfolded."

The Elliott Wave Financial Forecast asserted in April that hedge funds will be even more of a focal point for losses in the next wave down. The chart of the HFRX Index shows that global hedge fund performance has been essentially flat since 2011. The A-B-C rally from 2009 has now retraced 63% (5/8) of the decline from 2007-2008, so an even more precipitous downtrend seems near for hedge funds.

The U.S. Senate's Permanent Subcommittee on Investigations confirms the imminence of a reversal.

In July, Congress opened a major probe into the inner workings of the hedge fund industry. A report from one set of hearings is titled "Abuse of Structured Products: Misusing Basket Options to Avoid Taxes and Leverage Limits." The subcommittee recommended that regulators "take steps to examine complex financial arrangements."

It never fails. When a mania ends, the instruments of the uptrend are often subject to recrimination and "reform."

In the early 1930s, there was the Pecora Commission, which led to the Glass-Steagall Banking Act of 1933. This is a bigger peak, so the politicians will extract more than just their average pound of flesh.

To continue reading Hochberg and Kendall's 10-page issue of The Elliott Wave Financial Forecast, click here to join EWI's free Investors Open House now.


This article was syndicated by Elliott Wave International and was originally published under the headline Hedge Funds Surpass 2007 Leverage; New Era of 'Permanent Investigations' Confirms Imminent Reversal. EWI is the world's largest market forecasting firm. Its staff of full-time analysts led by Chartered Market Technician Robert Prechter provides 24-hour-a-day market analysis to institutional and private investors around the world.

Read more ...

BANKNIFTY PREMARKET NOTES—30 SEPT


BANKNIFTY PREMARKET NOTES:-

  • SGX NIFTY  is   25 POINTS GAP DOWN showing   FLAT to NEGATIVE OPENING  . So the BANKNIFTY also will open will around 70-80 POINTS GAP DOWN.
  • FII Activity – IN CASH BOUGHT ++150 CR / INDEX FUT BOUGHT ++99 CR


EVENTS TO WATCH:-

  • RBI Credit POLICY Announcement.


BANKNIFTY FUT DEMAND SUPPLY
1 15466 15623
2 15347 16723
3 15198 16845

These levels are where we have to watch how market reacts and we have to take decision as per the PRICE ACTION.

WHAT CHART is SAYING?

 image

  • Today RBI Policy declaration will be there around 11.00 AM. and markets will decide further trend after this POLICY.
  • As the Charts showing (Hourly) the trend is DOWN and still no signs of recovering. But we will wait for RBI Policy for any further clue.


FOLLOW US FOR LIVE

UPDATESON:-


TWITTER

FACEBOOK

Read more ...

Monday, September 29, 2014

BANKNIFTY PREMARKET NOTES—29 SEPT


BANKNIFTY PREMARKET NOTES:-

  • SGX NIFTY  is   35 POINTS GAP DOWN showing   NEGATIVE OPENING  . So the BANKNIFTY also will open will around 100 POINTS GAP DOWN.
  • FII Activity – IN CASH SOLD –  1134 CR / INDEX FUT SOLD --213 CR


BANKNIFTY FUT DEMAND SUPPLY
1 15650 15970
2 15500 16117
3 15280 16260

These levels are where we have to watch how market reacts and we have to take decision as per the PRICE ACTION.

WHAT CHART is SAYING?


  • After the yesterday’s S&P Upgrade and EXPIRY is over now market will show its natural trend. Long term Trend is UP. But Short term trend is DOWN.


FOLLOW US FOR LIVE

UPDATESON:-


TWITTER

FACEBOOK

Read more ...

Thursday, September 25, 2014

BANKNIFTY PREMARKET NOTES—25 SEPT


BANKNIFTY PREMARKET NOTES:-

  • SGX NIFTY  is   18 POINTS UP showing   FLAT TO POSITIVE OPENING  . So the BANKNIFTY also will open will around 50 POINTS GAP UP.
  • FII Activity – IN CASH SOLD –  793 CR / INDEX FUT SOLD --163 CR


EVENT to WATCH:-

EXPIRY is today so TRADE Cautiously.


BANKNIFTY FUT DEMAND SUPPLY
1 15729 15868
2 15650 16014
3 15500 16182

These levels are where we have to watch how market reacts and we have to take decision as per the PRICE ACTION.

WHAT CHART is SAYING?


  • After the SELLOFF of yesterday’s event now all news are over so BNF trend will be seen in 2-3 days to actual.


FOLLOW US FOR LIVE

UPDATESON:-


TWITTER

FACEBOOK

Read more ...

Wednesday, September 24, 2014

BANKNIFTY PREMARKET NOTES—24 SEPT


BANKNIFTY PREMARKET NOTES:-

  • SGX NIFTY  is   13 POINTS DOWN showing   FLAT TO NEGATIVE OPENING  . So the BANKNIFTY also will open will around 50 POINTS GAP DOWN.
  • FII Activity – IN CASH SOLD – 1185 CR / INDEX FUT SOLD --315 CR


EVENT to WATCH:-

SUPREME COURT result on COAL BLOCK ALLOCATION Case around 2 PM.


BANKNIFTY FUT DEMAND SUPPLY
1 15874 15962
2 15750 16063
3 15610 16182

These levels are where we have to watch how market reacts and we have to take decision as per the PRICE ACTION.

WHAT CHART is SAYING?


  • Banknifty seen SELLOFF from higher levels in last few minutes day before yesterday. This continued toward the range LOW of 15850 yesterday… so today we can expect it to go towards range low.


FOLLOW US FOR LIVE

UPDATESON:-


TWITTER

FACEBOOK

Read more ...

Tuesday, September 23, 2014

BANKNIFTY PREMARKET NOTES—23 SEPT


BANKNIFTY PREMARKET NOTES:-

  • SGX NIFTY  is   13 POINTS DOWN showing   FLAT TO NEGATIVE OPENING  . So the BANKNIFTY also will open will around 50 POINTS GAP DOWN.
  • FII Activity – IN CASH SOLD – 186.41 CR / INDEX FUT BOUGHT ++165 CR


BANKNIFTY FUT DEMAND SUPPLY
1 16113 16262
2 16010 16334
3 15910 16367

These levels are where we have to watch how market reacts and we have to take decision as per the PRICE ACTION.

WHAT CHART is SAYING?


  • Banknifty seen SELLOFF from higher levels in last few minutes yesterday. We expected this rangeboud movement to continue till EXPIRY and RANGE will be 16310 to 15850


FOLLOW US FOR LIVE

UPDATESON:-


TWITTER

FACEBOOK

Read more ...

Monday, September 22, 2014

How to Find Trading Opportunities in ANY Market: Fibonacci Analysis


 In this article, Elliott Wave International's Jeffrey Kennedy demonstrates ways to spot trading opportunities across any market and timeframe.

By Elliott Wave International

Elliott Wave International's Senior Analyst Jeffrey Kennedy is the editor of our Elliott Wave Trader's Classroom and one of our most popular instructors. Jeffrey's primary analytical method is the Elliott Wave Principle, but he also uses several other technical tools to supplement his analysis.

You can apply these methods across any market and any time frame.

Learn how you can get a free 14-page Fibonacci eBook at the end of this lesson.


The primary Fibonacci ratios that I use in identifying wave retracements are .236, .382, .500, .618 and .786. Some of you might say that .500 and .786 are not Fibonacci ratios; well, it's all in the math. If you divide the second month of Leonardo's rabbit example by the third month, the answer is .500, 1 divided by 2; .786 is simply the square root of .618.

There are many different Fibonacci ratios used to determine retracement levels. The most common are .382 and .618.

The accompanying charts also demonstrate the relevance of .236, .382, .500 .618 and .786. It's worth noting that Fibonacci retracements can be used on any time frame to identify potential reversal points. An important aspect to remember is that a Fibonacci retracement of a previous wave on a weekly chart is more significant than what you would find on a 60-minute chart.

With five chances, there are not many things I couldn't accomplish. Likewise, with five retracement levels, there won't be many pullbacks that I'll miss. So how do you use Fibonacci retracements in the real world, when you're trading? Do you buy or sell a .382 retracement or wait for a test of the .618 level, only to realize that prices reversed at the .500 level?

The Elliott Wave Principle provides us with a framework that allows us to focus on certain levels at certain times. For example, the most common retracements for waves two, B and X are .500 or .618 of the previous wave. Wave four typically ends at or near a .382 retracement of the prior third wave that it is correcting.

In addition to the above guidelines, I have come up with a few of my own over the past 10 years.

The first is that the best third waves originate from deep second waves. In the wave two position, I like to see a test of the .618 retracement of wave one or even .786. Chances are that a shallower wave two is actually a B or an X wave. In the fourth-wave position, I find the most common Fibonacci retracements to be .382 or .500. On occasion, you will see wave four retrace .618 of wave three. However, when this occurs, it is often sharp and quickly reversed.

My rule of thumb for fourth waves is that whatever is done in price, won't be done in time. What I mean by this is that if wave four is time-consuming, the relevant Fibonacci retracement is usually shallow, .236 or .382. For example, in a contracting triangle where prices seem to chop around forever, wave e of the pattern will end at or near a .236 or .382 retracement of wave three. When wave four is proportional in time to the first three waves, I find the .500 retracement significant. A fourth wave that consumes less time than wave two will often test the .618 retracement of wave three and suggests that more players are entering the market, as evidenced by the price volatility. And finally, in a fast market, like a "third of a third wave," you'll find that retracements are shallow, .236 or .382.

In closing, there are two things I would like to mention. First, in each of the accompanying examples, you'll notice that retracement levels repeat. Within the decline from the high in July Sugar (first chart), each countertrend move was a .618 retracement of the previous wave. The second chart demonstrates the same tendency with the .786 retracement. This event is common and is caused by the fractal nature of the markets.

Second, Fibonacci retracements identify high probability targets for the termination of a wave; they do not represent an absolute must-hold level. So when using Fibonacci retracements, don't be surprised to see prices reverse a few ticks above or below a Fibonacci target. This occurs because other traders are viewing the same levels and trade accordingly. Fibonacci retracements help to focus your attention on a specific price level at a specific time; how prices react at that point determines the significance of the level.


Learn How You Can Use Fibonacci to Improve Your Trading

If you'd like to learn more about Fibonacci and how to apply it to your trading strategy, download the free 14-page eBook, How You Can Use Fibonacci to Improve Your Trading.

EWI Senior Tutorial Instructor Wayne Gorman explains:

  • The Golden Spiral, the Golden Ratio, and the Golden Section
  • How to use Fibonacci ratios/multiples in forecasting
  • How to identify targets and turning points in the markets you trade
  • And more!

See how easy it is to use Fibonacci in your trading. Download your free eBook today >>

This article was syndicated by Elliott Wave International and was originally published under the headline How to Find Trading Opportunities in ANY Market: Fibonacci Analysis. EWI is the world's largest market forecasting firm. Its staff of full-time analysts led by Chartered Market Technician Robert Prechter provides 24-hour-a-day market analysis to institutional and private investors around the world.

Read more ...

BANKNIFTY PREMARKET NOTES—22 SEPT


BANKNIFTY PREMARKET NOTES:-

  • SGX NIFTY  is   55 POINTS DOWN showing   GAP DOWN OPENING after yesterdays PAUSE . So the BANKNIFTY also will open will around 150 POINTS GAP DOWN.
  • FII Activity – CASH SOLD –8.5 CR / INDEX FUT SOLD --43 CR


What we DID FRIDAY:-

-----We entered LONG at 16132  and booked FULL Profit at 16197 --we SHARED it on TWITTER .


 image

image

image

BANKNIFTY FUT DEMAND SUPPLY
1 15965 16181
2 15874 16303
3 15755 16367

These levels are where we have to watch how market reacts and we have to take decision as per the PRICE ACTION.

WHAT CHART is SAYING?

 image

  • Above 60 MIN chart shows how BNF is resisted at SUPPLY AREA of previous DOWNMOVE from around 16230 LEVELS… and that was STRONG DOWNMOVE.
  • This move was expected to take it towards 15979 (61.8% of the LATEST UPMOVE) and 15949 which is DEMAND ZONE.
  • This ZONE of 15949 to 15979 may SEE SOME GOOD BUYING INTEREST.


FOLLOW US FOR LIVE

UPDATESON:-


TWITTER

FACEBOOK

Read more ...

Sunday, September 21, 2014

Here's Why Trendlines are Your New Best Friend, Part 3


See how trendlines help you make calculated trading decisions

By Elliott Wave International

Have you ever seen Donald Duck play pool? Trust us, it isn't pretty.

An expert pool player, on the other hand -- well, he can just look at the billiards table and imagine lines drawn out, marking the trajectory the cue ball must take to make the shot.

Now, what if you could just look at a financial market's price chart -- and see actual lines drawn out that aim straight for the "pocket" of opportunity?

According to our resident Monthly Commodity Junctures editor and chief commodity analyst Jeffrey Kennedy, you can.

All you need to do is implement a tried-and-true tool of technical analysis known as trendlines. (And let's just say, what Paul Newman is to the game of pool in the Hustler, Jeffrey Kennedy is to the field of technical analysis in real life.)

In part 1 of our series, we showed you how Jeffrey used trendlines to identify a major break-out point in cocoa back in May 2014. Part 2 played the video of Jeffrey's April 2014 corn forecast, where he used trendlines to fortify his bearish wave count -- right before corn prices embarked on a powerful sell-off to 4-year lows.

Today, we're returning to that April 2014 Monthly Commodity Junctures video to show you 3 more examples of how Jeffrey used trendlines to "call the pocket" in coffee, sugar, and the U.S. dollar. Roll the tape!

Of coffee, Jeffrey said: "We can expect a counter-trend move back to near the previous fourth wave extreme, roughly say between 170 and 160.

Coffee prices indeed sold off in three waves (i.e. counter-trend action) to the "previous fourth wave extreme" after breaking through the lower boundary of the trend channel:

image

Of sugar, Jeffrey said: "Once complete, wave (Y) of the larger fourth wave will give way to additional selling to back below the actual 2014 low."

Here's what happened to sugar prices after they fell below their trendline:

image

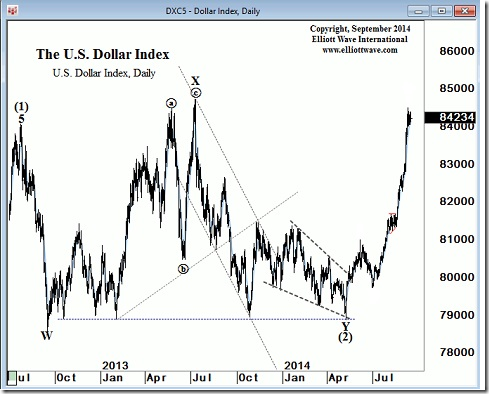
Of the U.S. dollar, Jeffrey said: "Ideally we'll begin to see this third wave move [up] develop soon... in a nice, volatile move to the upside."

The dollar indeed rallied strongly off that trendline:

image

It's safe to say, once you truly understand the risk-managing power of trendlines, they will become one of the most valuable tools in your technical toolbox. And nobody can attest to that fact more than Jeffrey Kennedy.

In fact, Jeffery loves trendlines so much, he wrote a book about them. Well, a free eBook -- titled "Trading the Line: 5 Ways You Can Use Trendlines to Improve Your Trading."

As the title of Jeffrey's eBook states, there are 5 ways trendlines improve your trading:

  1. Trendlines show you the dominant psychology of investors, be it bullish or bearish
  2. They define your risk via support and resistance price levels
  3. They give you advanced warning of potential price breakout points
  4. They help you identify critical moments in time
  5. Trendlines also tell you when the trend has turned

Want to learn how to draw your own trendlines -- and gain an advantage you've never had before?

Right now, we are offering the entire 17-page eBook (14 of those pages include Jeffrey's carefully chosen charts and analysis) as part of our FREE trader resources. Once you join the 325,000-plus members of our Club EWI family, it's yours for the reading -- at absolutely no cost.


This article was syndicated by Elliott Wave International and was originally published under the headline Here's Why Trendlines are Your New Best Friend, Part 3. EWI is the world's largest market forecasting firm. Its staff of full-time analysts led by Chartered Market Technician Robert Prechter provides 24-hour-a-day market analysis to institutional and private investors around the world.

Read more ...

Friday, September 19, 2014

BANKNIFTY PREMARKET NOTES—19 Sept


BANKNIFTY PREMARKET NOTES:-

  • SGX NIFTY  is  8 POINTS UP showing   FLAT TO POSITIVE OPENING after yesterdays HUGE UPMOVE . So the BANKNIFTY also will open will around 20-30 POINTS GAP UP.
  • FII Activity – CASH SOLD --9 CR / INDEX FUT BOUGHT ++644 CR


What we DID YESTERDAY:-

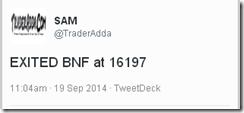
-----We entered LONG at 15844  and we SHARED it on TWITTER .

image


BANKNIFTY FUT DEMAND SUPPLY
1 16111 16246
2 15996 16303
3 15874 16367

These levels are where we have to watch how market reacts and we have to take decision as per the PRICE ACTION.

DAILY CHART:-


  • After yesterday’s  good UPMOVE in BANKNIFTY now it is expected a CONSOLIDATION or a PAUSE DAY today.
  • As per DAILY CHART this is the PLACE from where downmove is started. So here there will be SOME efforts will be seen from BEARS
  • Banknifty Daily Candle is STRONG BULLISH ENGULFING  CANDLE .


FOLLOW US ON:-


TWITTER

FACEBOOK

Read more ...

Thursday, September 18, 2014

BANKNIFTY PREMARKET NOTES—18 Sept


BANKNIFTY PREMARKET NOTES:-

  • SGX NIFTY  is  35 POINTS DOWN showing   GAP DOWN  OPENING after yesterdays PAUSE CO . So the BANKNIFTY also will open will around 100  POINTS GAP down.
  • FII Activity – CASH BOUGHT ++136 CR / INDEX FUT BOUGHT ++52 CR


BANKNIFTY FUT DEMAND SUPPLY
1 15807 15990
2 15730 16115
3 -- 16210

These levels are where we have to watch how market reacts and we have to take decision as per the PRICE ACTION.

DAILY CHART:-

image

  • After a BIG DOWNMOVE on16 Sept Banknifty taken a PAUSE Yesterday.
  • . And Still Banknifty weakness  is looking to be continued. There are no SIGNS of recovery is till shown.
  • Banknifty Daily Candle is CONTINUATION BEARISH  CANDLE .
  • Now as the DAILY CHART SHOWs BANKNIFTY CAN have a GOOD SUPPORT at 15730.


FOLLOW US ON:-


TWITTER

FACEBOOK

Read more ...

Wednesday, September 17, 2014

Don't Get Ruined by These 10 Popular Investment Myths (Part V)


Interest rates, oil prices, earnings, GDP, wars, terrorist attacks, inflation, monetary policy, etc. -- NONE have a reliable effect on the stock market

By Elliott Wave International

You may remember that during the 2008-2009 financial crisis, many called into question traditional economic models.

Why did the traditional financial models fail? And more importantly, will they warn us of a new approaching doomsday, should there be one?

This series gives you a well-researched answer.

Here is Part V; come back soon for Part VI.


Myth #5: "GDP drives stock prices."
By Robert Prechter (excerpted from the monthly Elliott Wave Theorist; published since 1979)

Surely the stock market reflects the nation's Gross Domestic Product. The aggregate success of corporations shows up as changes in GDP. Stocks are shares in corporations. How could their prices not reflect the ebb and flow of GDP?

Suppose that you had perfect foreknowledge that over the next 3 3/4 years GDP would be positive every single quarter and that one of those quarters would surprise economists in being the strongest quarterly rise in a half-century span. Would you buy stocks?

If you had acted on such knowledge in March 1976, you would have owned stocks for four years in which the DJIA fell 22%. If at the end of Q1 1980 you figured out that the quarter would be negative and would be followed by yet another negative quarter, you would have sold out at the bottom.

Suppose you were to possess perfect knowledge that next quarter's GDP will be the strongest rising quarter for a span of 15 years, guaranteed. Would you buy stocks?

Had you anticipated precisely this event for 4Q 1987, you would have owned stocks for the biggest stock market crash since 1929. GDP was positive every quarter for 20 straight quarters before the crash and for 10 quarters thereafter. But the market crashed anyway. Three years after the start of 4Q 1987, stock prices were still below their level of that time despite 30 uninterrupted quarters of rising GDP.

Figure 10 shows these two events. It seems that there is something wrong with the idea that investors rationally value stocks according to growth or contraction in GDP.

Interest rates, oil prices, trade balances, corporate earnings and GDP: None of them seem to be important, or even relevant, to explaining stock price changes. But you need not trust your own eyes. In a study that is stunning for its boldness in actually checking basis premises, Cutler, Poterba and Summers in a paper for the Journal of Portfolio Management in 1989 investigated the effect of economic news on stock prices and concluded,

"Macroeconomic news bearing on fundamental values...explains only about one fifth of the movement in stock prices."

Even here, I would question the conclusion that such news "explains" even 1/5 of the movement in stock prices. Surely a set of football statistics could generate a 1/5 correlation to the S&P. And every correlation, to have meaning, must have a theory to account for it.

What theory accommodates the idea that macroeconomic fundamentals explain 1/5 of stock price changes? If there is no accommodating theory, then the presumed causality involved is tenuous at best.v

(Stay tuned for Part VI of this important series, where we examine another popular investment myth: Namely, that "Wars are bullish/bearish for stock prices.")


Free Report:
"The Biggest Lie in Stock Market History"

Dear Reader,

We believe risks and opportunities even larger than those of 2007-2009 lie ahead in a bear market of epic proportions.

Only problem is, this bear market is silent right now. It's not visible to the public, because the government and the Federal Reserve inflate the credit supply and the U.S. dollar to hide its impact.

But make no mistake about it: There is a Silent Crash going on right now in the stock market, and it's having a very real impact on your spending power.

Read this special report now, free -- and see 15 eye-opening charts >>

Read more ...

BANKNIFTY PREMARKET NOTES—17th SEPT


BANKNIFTY PREMARKET NOTES:-

  • SGX NIFTY  is  50 POINTS UP showing  BIG GAP UP  OPENING after yesterdays SHARP CORRECTION . So the BANKNIFTY also will open will 100 to 150  POINTS GAP UP.
  • FII Activity – CASH SOLD --828 CR / INDEX FUT SOLD -- 162 CR


BANKNIFTY FUT DEMAND SUPPLY
1 15878 16024
2 15825 16130
3 15966 16210

These levels are where we have to watch how market reacts and we have to take decision as per the PRICE ACTION.

DAILY CHART:-

image

  • As we expected yesterdays Premarket Notes it played well and BNF given the EXPECTED BIG downmove.
  • NOW the Previous Support May act as Resistance.
  • Now the ZONE will be 16100 to 15850 for the DAY.
  • Banknifty Daily Candle is BEARISH ENGULFING CANDLE .
  • Now as SGX NIFTY is suggesting GAP UP..we can expect 61.8% retracement which CURRENTLY at 16137.


FOLLOW US ON:-


TWITTER

FACEBOOK

Read more ...

Tuesday, September 16, 2014

3 WAYs TO SELECT STOCKS/SCRIPS FOR INTRADAY TRADING


image

Intraday Trading stock selection is a hard TASK for many Traders. There are many Ways to Select Stocks for INTRADAY TRADING. We will list few of them here which we consider that many successful TRADERs are using. Following are the ways to SELECT STOCKS/SCRIPS for INTRADAY TRADING.

1. FIXED STOCKS EVERY DAY:-

  • This is the method which many REGULAR TRADERS are using( I am ONE OF THEM). They SELECT some stocks which have GOOD VOLUME  and INTRADAY VOLATILITY THAT ONE CAN HANDLE.
  • One can SELECT from 2 to 10 STOCKS and can trade them REGULARY with your TRADING METHOD’s SIGNAL. ( LESS no of STOCKs is good. )
  • This method which I feel is useful COZ we are TRACKING SAME STOCKS for everyday. So we are aware about its levels in general.
  • Many of the TRADERS Trade ONLY NIFTY FUTURE and/or BANKNIFTY FUTURE everyday.

2. STOCKS IN NEWS:-

  • This method is also USED BY MANY ELITE TRADERS. This method is HIGH RISK and HIGH REWARD METHOD.
  • For this one have to go and watch the TELEVISION in the MORNING after 8’O Clock on CNBC AWAAZ and ZEE BUSINESS they SHOW STOCKS in news. (TIMING MAY DIFFER) Here they tell about the stocks which are in NEWS for today.
  • Here you can select FEW of them which have HIGHER NEWS VOLATILITY expected. For Ex. When the news SUPREME COURT NEWS about COAL SCAM COMES the Stocks which are related to it are definitely expected to give GOOD INTRADAY MOVES.
  • ONLY THING is that ONE NEEDs to BE CAUTIOUS and to go with the LATEST INTRADAY TREND with STRICT STOPLOSS. Because there can be sudden moves which MAY REWARD you highly or HARM you HIGHLY.

3.  WEAK STOCK WEAK SECTOR/ STRONG STOCK STRONG SECTOR:-

  • This is also one of the GOOD PROVEN Method to select the STOCKs for INTRADAY TRADING.
  • Here you can go to the SITES LIKE MONEYCONTROL where you can find STRONG/WEAK SECTORS and then find STRONG STOCK from STRONG SECTOR and WEAK STOCK FROM WEAK SECTOR.
  • Here one has to FIND OPPORTUNITIES in the Direction of Trend.

We will LIST the other METHODS as and when we COME ACROSS it.

HELP US SPREAD the

WORD FOLLOW US ON:-


TWITTER

FACEBOOK

Read more ...

Don't Get Ruined by These 10 Popular Investment Myths (Part IV)


Interest rates, oil prices, earnings, GDP, wars, terrorist attacks, inflation, monetary policy, etc. -- NONE have a reliable effect on the stock market

By Elliott Wave International

You may remember that during the 2008-2009 financial crisis, many called into question traditional economic models.

Why did the traditional financial models fail? And more importantly, will they warn us of a new approaching doomsday, should there be one?

This series gives you a well-researched answer.

Here is Part IV; come back soon for Part V.


Myth #4: "Earnings drive stock prices."
By Robert Prechter (excerpted from the monthly Elliott Wave Theorist; published since 1979)

This belief powers the bulk of the research on Wall Street. Countless analysts try to forecast corporate earnings so they can forecast stock prices. The exogenous-cause [i.e., news-driven -- Ed.] basis for this research is quite clear:

Corporate earnings are the basis of the growth and the contraction of companies and dividends. Rising earnings indicate growing companies and imply rising dividends, and falling earnings suggest the opposite. Corporate growth rates and changes in dividend payout are the reasons investors buy and sell stocks.

Therefore, if you can forecast earnings, you can forecast stock prices.

Suppose you were to be guaranteed that corporate earnings would rise strongly for the next six quarters straight. Reports of such improvement would constitute one powerful "information flow." So, should you buy stocks?

Figure 9 shows that in 1973-1974, earnings per share for S&P 500 companies soared for six quarters in a row, during which time the S&P suffered its largest decline since 1937-1942.

This is not a small departure from the expected relationship; it is a history-making departure. Earnings soared, and stocks had their largest collapse for the entire period from 1938 through 2007, a 70-year span! Moreover, the S&P bottomed in early October 1974, and earnings per share then turned down for twelve straight months, just as the S&P turned up!

An investor with foreknowledge of these earnings trends would have made two perfectly incorrect decisions, buying near the top of the market and selling at the bottom.

In real life, no one knows what earnings will do, so no one would have made such bad decisions on the basis of foreknowledge. Unfortunately, the basis that investors did use -- and which is still popular today -- is worse:

They buy and sell based on estimated earnings, which incorporate analysts' emotional biases, which are usually wrongly timed.

But that is a story we will tell later. Suffice it for now to say that this glaring an exception to the idea of a causal relationship between corporate earnings and stock prices challenges bedrock theory. ...

(Stay tuned for Part V of this important series, where we examine another popular investment myth: Namely, that "GDP drives stock prices.")


Free Report:
"The Biggest Lie in Stock Market History"

Dear Reader,

We believe risks and opportunities even larger than those of 2007-2009 lie ahead in a bear market of epic proportions.

Only problem is, this bear market is silent right now. It's not visible to the public, because the government and the Federal Reserve inflate the credit supply and the U.S. dollar to hide its impact.

But make no mistake about it: There is a Silent Crash going on right now in the stock market, and it's having a very real impact on your spending power.

Read this special report now, free -- and see 15 eye-opening charts >>

Read more ...

BANKNIFTY PREMARKET NOTES- 16th SEPT


BANKNIFTY PREMARKET NOTES:-

  • SGX NIFTY  is  24 POINTS down showing  GAP DOWN  OPENING. So the BANKNIFTY also will open will 70 POINTS GAP DOWN.
  • FII Activity – CASH SOLD --74 CR / INDEX FUT SOLD -- 1394 CR
  • AS the DATA From LAST FEW DAYS are SHOWGIN FII’s are SELLING at INTRADAY HIGHER LEVELS.


BANKNIFTY FUT DEMAND SUPPLY
1 16149 16250
2 16037 16306
3 15966 16366

These levels are where we have to watch how market reacts and we have to take decision as per the PRICE ACTION.

DAILY CHART:-

image

  • There is STILL RSI DIVERGENCE on DAILY CHART. Which is showing to be PLAYING.
  • Yesterday we seen weakness in BANKNIFTY FUT for the FIRST TIME as DAILY CANDLE is showing RED CANDLE and HIGH of EARLIER day is not broken
  • Now the ZONE will be 16366 to 16100 which broken on EITHER SIDE will give the direction.
  • Banknifty Daily Candle is RED CANDLE indicating WEAKNESS.


FOLLOW US ON:-


TWITTER

FACEBOOK

Read more ...

Monday, September 15, 2014

5 BEST Places to GET FREE INTRADAY MCX, NCDEX and NSE/NFO CHARTS


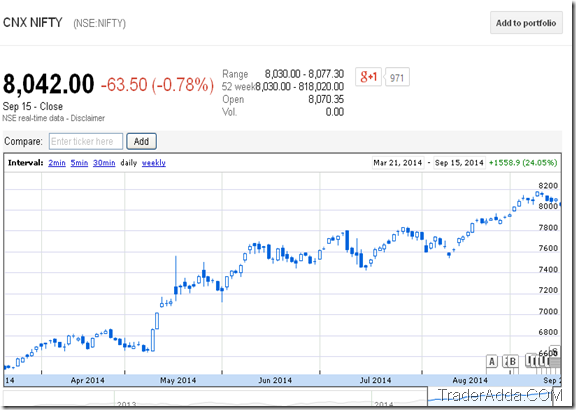
There are many PEOPLE searching  for the FREE LIVE and REALTIME INTRADAY NSE / NFO and MCX COMMODITES Charts.

So we wanted to put all these at ONE PLACE  where one can get FREE INTRDAY REALTIME and LIVE CHARTS ONLINE.

1. BAZAARTREND:-

REFER to OUR DETAILED ARTICLE ABOUT BAZAARTREND

2. TradersCockPIT:-

image

3. MarketCalls:-

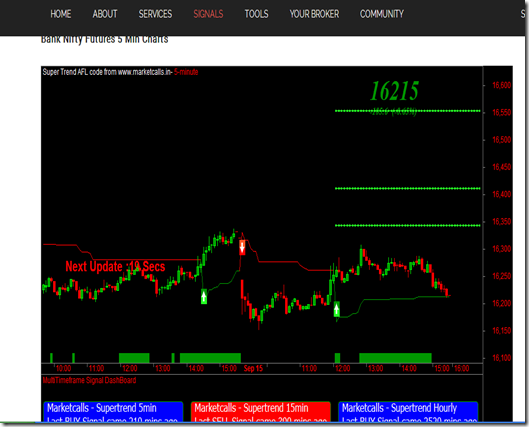
  • This BLOG is a excellent Resource for getting FREE INTRADAY CHARTS of selected NSE CASH and FUTURE SCRIPS.
  • SELECTED MCX Commodities charts are also available.
  • One good advantage is that these charts Come with Automated Buy Sell SIGNALS with Three TGT LEVELS --System Developed by the Author of the Blog Rajendran
  • The only thing is that these Charts are not Customizable means you can not change timeframe you want  can not put the indicator your want.
  • They are not tick by tick updated they will be refreshed after every 5 mins.

image

4. INVESTING.COM

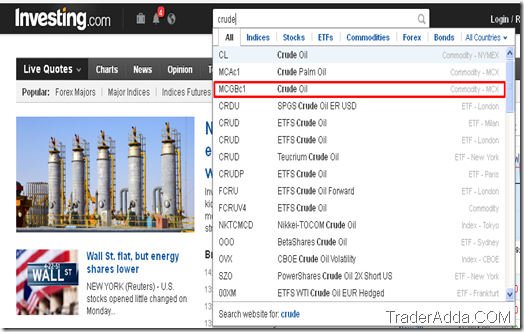
  • This is a very BIG SITE which I USE for getting various DATAS.
  • Here you get MCX COMMODITIES Charts and also NSE EQUITY Charts.
  • But Commodities Charts are delayed by sometime around 5 mins as per our observation.

image

image

5. Google Charts:-

  • Here you get all NSE INDEX and EQUITY CHARTS REALTIME and LIVE INTRADAY and EOD CHARTS are THERE.
  • No Commodity Charts are available.
  • Here you get SPOT CHARTS for INDEX and CASH(EQUITY CHARTS) –No Future and Option Charts.
  • But If you want very simple charts then this is the PLACE.

image

Hope you this Article is useful for you…

PLZ LIKE/SHARE THIS ON on FACEBOOK

Read more ...

BANKNIFTY PREMARKET NOTES—15th SEPT


BANKNIFTY PREMARKET NOTES:-

  • SGX NIFTY  is  54 POINTS down showing HUGE GAP DOWN  OPENING. So the BANKNIFTY also will open will 100 to 150 POINTS GAP DOWN.
  • FII Activity – CASH Bought ++182 CR / INDEX FUT SOLD -- 496 CR

OUR POSITION:-

We are SHORT in BANKNIFTY at CLOSE on FRIDAY and we SHARED the SAME MESSAGE ON TWITTER/FACEBOOK

image

FOLLOW US ON:-


TWITTER

FACEBOOK

BANKNIFTY FUT DEMAND SUPPLY
1 16207 16317
2 16149 16366
3 16037 --

These levels are where we have to watch how market reacts and we have to take decision as per the PRICE ACTION.

DAILY CHART:-

 image

  • There is STILL RSI DIVERGENCE on DAILY CHART.
  • We seen BANKNIFTY FUT went to the SUPPLY ARE of 16330, now the ZONE will be 16366 to 16100 which broken on EITHER SIDE will give the direction.
  • Banknifty Daily Candle is INSIDE CANDLE.
Read more ...

Friday, September 12, 2014

BANKNIFTY PREMARKET NOTES- 12 SEPT


BANKNIFTY PREMARKET NOTES:-

  • SGX NIFTY  is  8 POINTS down showing FLAT TO NEGATIVE OPENING.
  • FII Activity – CASH ++433 CR / INDEX FUT ++32 CR
BANKNIFTY FUT DEMAND SUPPLY
1 16230 16319
2 16149 16366
3 16037 --

These levels are where we have to watch how market reacts and we have to take decision as per the PRICE ACTION.

DAILY CHART:-

  • There is STILL RSI DIVERGENCE on DAILY CHART.
  • Also Banknifty broken  ZONE of 16294 to 16105 ON UPSIDE but it not sustained there and CLOSED again in the ZONE.
  • Banknifty Daily Candle showing DOJI CANDLE which showing INDECISION.
Read more ...

Thursday, September 11, 2014

BANKNIFTY PREMARKET NOTES-11 SEPT


BANKNIFTY PREMARKET NOTES:-

BANKNIFTY FUT DEMAND SUPPLY
1 16149 16261
2 16037 16294
3 16837 --

These levels are where we have to watch how market reacts and we have to take decision as per the PRICE ACTION.

DAILY CHART:-

image

  • As above Chart Clearly Shows RSI DIVERGENCE on DAILY CHART.
  • Also Banknifty is in a ZONE of 16294 to 16105 and this ZONE if broken on either side and if sustained for some time it will give good move.
Read more ...

Wednesday, September 10, 2014

Here's Why Trendlines Are Your New Best Friend, Part 2


See how trendlines help you manage risk in this real-world example from this free eBook

By Elliott Wave International

One of the best aspects of technical analysis is also its biggest drawback: Namely, there are far too many indicators to choose from.

Candlesticks to channels, Relative Strength Index to Bollinger Bands, double tops to moving averages...

Geez! With so many options, you're liable to feel like a "hanging man" beneath "dark cloud cover."

But in reality, all you need is one good, solid place to start; one indicator that can be your technical rock of Gibraltar.

For Elliott Wave International's chief commodity analyst Jeffrey Kennedy, that honor goes to one of the oldest names in the book: trendlines. Back in 2004, Jeffrey went on the record with this tribute:

I believe that trendlines are one of the simplest, yet most powerful tools an analyst can employ. An early mentor of mine said it best when he pointed out that "a kid with a ruler could make a million dollars" by simply drawing trendlines on price charts.

Last week, we showed you how Jeffery used an easily-drawn trendline to anticipate a bullish breakout point in cocoa back in early May.

Today, we're following up with another real-world example, only this time, you'll see how Jeffrey used trendlines to identify lasting levels of price resistance in the most popular grain market, corn.

In his April 2014 Monthly Commodity Junctures Wave Watch video, Jeffrey showed subscribers how a four-month old trendline ensured that corn's upside was limited:

The next chart shows you how corn prices did indeed bump up against their long-time trendline, reversed, and sold off in a powerful decline to their lowest level not just for 2014 -- but their lowest level in four years.

Jeffrey finds trendlines so valuable that he wrote a book about them!

Well, an eBook: a (free) 17-pager titled "Trading the Line: 5 Ways You Can Use Trendlines to Improve Your Trading."

Here's another excerpt:

Look where the upper boundary line provided resistance [in Google]. Notice there is another use for it. The midpoint of the trendline provides resistance in four different areas, which is why I include the center point or the midline when I draw parallel trendlines or price channels.

As the title of Jeffrey's eBook states, there are 5 ways trendlines improve your trading:

  1. Trendlines show you the dominant psychology of investors, be it bullish or bearish
  2. They define your support and resistance price levels
  3. They give you advanced warning of potential price breakout points
  4. They help you identify critical moments in time
  5. Trendlines also tell you when the trend has turned

Want to learn how to draw your own trendlines -- and gain an advantage you've never had before?

Right now, our friends over at Elliott Wave International have the entire 17-page eBook on their shelf of FREE trader resources. It's yours for the reading, right now -- at absolutely no cost.

Follow this link for your free instant download of Jeffrey Kennedy's 17-page eBook Trading the Line: 5 Ways You can Use Trendlines to Improve Your Trading.


This article was syndicated by Elliott Wave International and was originally published under the headline Here's Why Trendlines Are Your New Best Friend, Part 2. EWI is the world's largest market forecasting firm. Its staff of full-time analysts led by Chartered Market Technician Robert Prechter provides 24-hour-a-day market analysis to institutional and private investors around the world.

Read more ...

Sunday, September 7, 2014

JP ASSOCIATES –What is NEXT? HIGHEST VOLUME SEEN in LAST THREE YEARS.


JP Associates in NEWS:- Last week JP Associates in News due to the Shares Sold by its Promoters. And that too after very short period after they PUT QIP.(at around Rs 70)

So people were really worried about their SHARE SALE. And After the news hit the Markets there was a BLOODBATH for Two Days and Share Fell down by more than 30% in two days.

What is NEXT FOR JP ASSOCIATES?

Possibilities:-

1. Weekly Chart:- HUGE VOLUME in LAST THREE YEARS

image

  • Weekly chart showing the SUPPORT (Demand Area ) in the ZONE of  32.50 to 28.60 so for this week one can expect that it will take SUPPORT at these levels.
  • But the real thing what is PLAYING the MAIN CONCERN is VOLUME Last week has shown the highest ever volumes in JP ASSOCIETS in LAST THREE YEARS. So this is the main Concern where they are going to take the PRICE.

2. DAILY Chart :- HUGE VOLUME in LAST TWO DAYS.

image

  • Price has broken the STRONG Demand area with HUGE VOLUMES and Knocking the NEXT LEVELS of DEMAND.
  • RSI in OVERSOLD area but still not showing any traces of reversal.
  • Volume in LAST two DAYS has PICK UP to the HIGHEST in LAST THREE YEARS.

3. IF BOUNCE --where can it take?

image

  • For the Bounce if it has to come the levels of FIBINACCI 23% and 38% can be the First levels to be expected. These are 46 and 54.25 Respectively.
  • For this we have to CONFIRM the PRICE ACTION in SMALLER TIME FRAMES LIKE 60M or 30M on MONDAY-TUESDAY.


CONCLUSION:-

     Though there is a HUGE CONCERN of INCREASED VOLUME. But still if one has to PLAY then One can buy in the Range of 31-32 with Stoploss Below 28.

But we would better wait for the Further PRICE ACTION in PLAY for the CONFIRMATION of the further COURSE OF ACTION.

Read more ...

Saturday, September 6, 2014

Don't Get Ruined by These 10 Popular Investment Myths (Part III)


Interest rates, oil prices, earnings, GDP, wars, terrorist attacks, inflation, monetary policy, etc. -- NONE have a reliable effect on the stock market

By Elliott Wave International

You may remember that during the 2008-2009 financial crisis, many called into question traditional economic models. Why did the traditional financial models fail?

And more importantly, will they warn us of a new approaching doomsday, should there be one?

That's a crucial question to your financial well-being. This series gives you a well-researched answer.

Here is Part III; come back soon for Part IV.


Myth #3: "Expanding trade deficit is bad for economy -- and bearish for stocks."
By Robert Prechter (excerpted from the monthly Elliott Wave Theorist; published since 1979)

Over the past 30 years, hundreds of articles -- you can find them on the web -- have featured comments from economists about the worrisome nature of the U.S. trade deficit. It seems to be a reasonable thing to worry about.

But has it been correct to assume throughout this time that an expanding trade deficit impacts the economy negatively?

Figure 8 answers this question in the negative:

In fact, had these economists reversed their statements and expressed relief whenever the trade deficit began to expand and concern whenever it began to shrink, they would have accurately negotiated the ups and downs of the stock market and the economy over the past 35 years. The relationship, if there is one, is precisely the opposite of the one they believe is there. Over the span of these data, there in fact has been a positive -- not negative -- correlation between the stock market and the trade deficit.

So the popularly presumed effect on the economy is 100% wrong. Once again, economists who have asserted the usual causal relationship neglected to check the data.

And it is no good saying, "Well, it will bring on a problem eventually." Anyone who can see the relationship shown in the data would be far more successful saying that once the trade deficit starts shrinking, it will bring on a problem.

Around 1998, articles began quoting a minority of economists who -- probably after looking at a graph such as Figure 8 -- started arguing the opposite claim. Fitting all our examples so far, they were easily able to reverse the exogenous-cause argument and have it still sound sensible. It goes like this:

In the past 30 years, when the U.S. economy has expanded, consumers have used their money and debt to purchase goods from overseas in greater quantity than foreigners were purchasing goods from U.S. producers. Prosperity brings more spending, and recession brings less. So a rising U.S. economy coincides with a rising trade deficit, and vice versa.

Sounds reasonable!

But once again there is a subtle problem. If you examine the graph closely, you will see that peaks in the trade deficit preceded recessions in every case, sometimes by years, so one cannot blame recessions for a decline in the deficit.

Something is still wrong with the conventional style of reasoning.

(Stay tuned for Part IV of this important series, where we examine another popular investment myth: Namely, that "Earnings drive stock prices.")


Free Report:
"The Biggest Lie in Stock Market History"

Dear Reader,

We believe risks and opportunities even larger than those of 2007-2009 lie ahead in a bear market of epic proportions.

Only problem is, this bear market is silent right now. It's not visible to the public, because the government and the Federal Reserve inflate the credit supply and the U.S. dollar to hide its impact.

But make no mistake about it: There is a Silent Crash going on right now in the stock market, and it's having a very real impact on your spending power.

Read this special report now, free -- and see 15 eye-opening charts >>

Read more ...

Friday, September 5, 2014

TICKAVG (ATP) – a GREAT TOOL YOU CAN USE FOR TRADING.


image

TICK AVG OR ATP (Average Trading PRICE):-

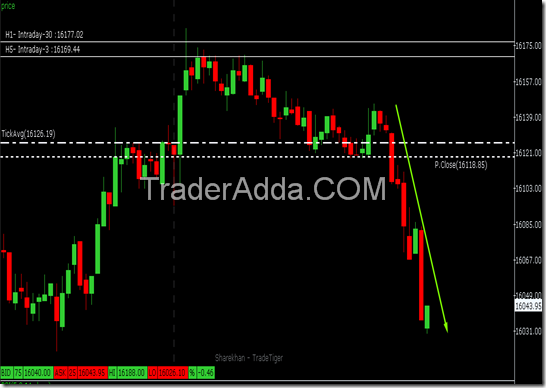
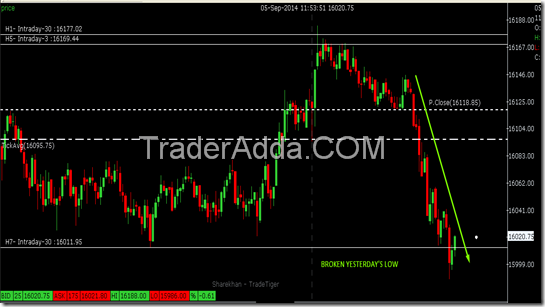
  • Above Chart is SELF EXPLAINATORY. You see that line with DASH DOT.. that line is a TICKAVG line (SOME OTHER CALL it as ATP – Average Trading Price)


  • See its effect on the PRICE… in POINT 1 TICKAVG is Crossed by Price on Downside and then it came to Test it…. again it Tested TickAvg…. and See the Reaction of Price to IT… PRICE CAME DOWN From Tick AVG.


  • While Writing this Article after above chart is taken… see in below chart how Price came down FAST while I writing this POST and after above CHART is Taken.

image


CHART UPDATE AT 11.15 AM

image

CHART UPDATE AT 11.24 AM

image

CHART UPDATE AT 11.54 AM


image

Read more ...

BANKNIFTY PRICE ACTION—POSSIBLE TRADE


30 MIN CHART:-

image

  • Above 30 MIN CHART SEEE Previous supply showing in 30 MIN at 16177 and BANKNIFTY FACING RESISTANCE there. We should need the Confirmation on Small TimeFrame Chart.

3 MIN CHART :-

image

  • See in above chart we see SMALL SUPPLY is Created at No 1 and it again came at Point 2 where we taken Short at 16169 with SL above DAY HIGH… and we AIM for 1st TGT of 16125 which is the 2nd CANDLE which is the BIG GREEN CANDLE… so achieved that 1st TGT.
Read more ...
 

Popular Posts

Latest From TraderAdda

McAfee SECURE sites help keep you safe from identity theft, credit card fraud, spyware, spam, viruses and online scams

Man Behind TraderAdda

, a Graduate in Science is a part time blogger and Full Time Professional Trader from India.

At TraderAdda he writes about Trading Systems, Amibroker Indicators and AFLs, Trading Ebooks, Trading Resources, Nifty Intraday Levels, Nifty Positional View, and many more other Trading Resources.

His area of interest are Technical Analysis, Developing Trading Strategies, Blogging, Gadgets and Reading.

Hope you will find TraderAdda useful. Your comments/Suggestions/Feedback
is important for us.

Join me for Regular Updates on Twitter

Total Pageviews

Protected Site- Do not Copy